FAQ: List and map of wastewater spills in Quebec
Do you have a question about our map or our list?
Our team has written these frequently asked questions to try to clarify certain aspects of the map and the list of wastewater spills. feel free to communicate with us if you need further information.
What is a outfall?
Le Ministère de l’Environnement définit un déversement comme « tout rejet, dans l’environnement ou dans un système de gestion des eaux pluviales, d’eaux usées non traitées. Les débordements ont lieu dans le réseau d’égout (réseau de conduite), en amont de la station d’épuration. Les débordements s’effectuent généralement à des ouvrages de surverse prévus à cet effet.
Each treatment plant has a maximum treatment capacity which is calculated in m3 of water per day (1 m3 = 1,000 L). These stations are supplied by a sewer network interspersed with various structures, including pumping stations and overflow structures. The function of the pumping station is to push the water towards the station, while the overflow structures are the equivalent of circuit breakers: they are there to protect the station and the sewer network against water overloads.
When there is too much water, in case of heavy rains for example, the flow exceeds what the network is able to take and this causes a discharge of wastewater directly into the rivers. Spill, overflow and overflow are all synonyms.
Le Québec comptait 829 stations et 4 577 ouvrages en 2023.
What are the impacts of outfalls?
Wastewater outfalls can affect both the environment and public health.
Untreated wastewater contains many contaminants (suspended solids, oxygen demand, nutrients including nitrogen and phosphorus, microbes, oils and greases, pharmaceuticals, micro-plastics, etc.) that can affect the aquatic fauna. These contaminants can deprive affected organisms of dissolved oxygen, expose them to viruses or bacteria, alter their biochemistry or degrade the quality of their breeding or feeding environments.
The quality of aquatic environments can also be affected by overflows. Overflows can cause the release of non-biodegradable solids, accelerated eutrophication due to nutrient inputs, blue-green algae blooms, decreased dissolved oxygen, decreased water clarity, or other changes in the physical and chemical characteristics of the water.
Outfalls can also pose a public health risk by compromising the quality of the water, making it unsuitable for recreational use (swimming, canoeing, kayaking, etc.). Finally, they have the effect of affecting the drinking water treatment costsand even to limit the production of drinking water in the short term.
While we consider that all forms of overflow should be avoided, we are aware that the majority of overflow is caused by a liability of infrastructure built at a time when the common practice was to discharge stormwater through the sewer system without treatment and as quickly as possible into the environment. We also recognize that the dilution capacity of a receiving environment can reduce the impacts of outfalls on it. That being said, we are convinced that Quebec can aspire to better results in reducing the frequency and intensity of overflows into its waterways.
Que signifie un dépassement de normes ?
Un dépassement de normes se produit lorsqu’il y a un débordement par temps sec à n’importe quel moment de l’année (norme réglementaire) ou lorsqu’il y a un dépassement du seuil établi par le MELCCFP pour les périodes de temps de pluie (normes supplémentaires). ».
Qu’est-ce qu’une norme de débordement ?
Il y a deux types de normes de débordement :
- According to many experts, the norme de débordement réglementaire est basée sur le Regulation respecting municipal wastewater treatment works (ROMAEU). Elle interdit tout débordement par temps sec (art. 8). Nous la présentons dans notre tableau Respect des normes, à la colonne « Norme temps sec ».
- The normes de débordement supplémentaires correspondent au nombre de débordements autorisés en période de pluie ou de fonte par le MELCCFP pour une période de temps jugée critique pour la rivière ou le lac. Pour en savoir plus sur le calcul de ces normes, rendez-vous à la question « Comment sont calculées les normes supplémentaires de débordement par le MELCCFP ? ». C’est cette norme qui est présentée dans notre tableau Respect des normes, à la colonne « Dépassements temps de pluie ».
Comment sont calculées les normes supplémentaires de débordement par le MELCCFP ?
Les normes supplémentaires de débordement (par temps de pluie) sont fixées par le MELCCFP. Le MELCCFP étudie les caractéristiques du milieu récepteur (ex. débit, rivière ou lac, présence d’habitats fauniques sensibles), ainsi que les usages (ex. prise d’eau potable, abreuvement du bétail, baignade) et il détermine la période critique durant laquelle les débordements doivent être limités.
Dès que leur nombre de débordements durant la période normée dépasse la limite fixée par le ministère, l’ouvrage est considéré comme étant en manquement. Le ministère peut intervenir après deux années consécutives de manquements ou trois années de manquements sur les cinq dernières années.
Pour plus de détails sur les différents critères considérés, consultez l’Annexe 5 du document sur les Références techniques pour la première attestation d’assainissement municipal produit par le MELCCFP. Pour mieux comprendre la façon dont sont formulées les normes de débordement, vous pouvez consulter l’Annexe 7.
What is a derivation?
The Ministry of the Environment defines a derivation As « any discharge of wastewater partially treated in the environment due to bypassing a treatment step at the wastewater treatment plant, diversions therefore occur at the plant. Any discharge downstream of a bar screen is considered to be a diversion. »
Most of the time, diversions occur after the pre-treatment stage—that is, after the wastewater has been screened and grit removed. In other words, solids are generally removed from this type of discharge. However, the subsequent treatment steps are often bypassed during a diversion event. As a result, these water discharges retain a high oxygen demand (BOD5) and remain loaded with microbes, viruses, nutrient elements (nitrogen and phosphorus), and other soluble contaminants.
Although the pollutant load from a diversion is lower than that of an overflow, the volume discharged during a diversion is usually much greater than that during an overflow for a given wastewater treatment plant.
Why talk about outfall intensity?
It is very difficult to measure the amount of sewage that escapes into rivers in the event of an outfall. These data do not exist. However, we do know the size of each of the structures that overflow. It is also known that the larger the structure, the greater the volume of wastewater that is likely to be released during an outfall.
For this reason, we developed the Spill Intensity Index, an index that takes into account the design flow of the treatment plant, the size of the structure that overflowed, and the duration of each outfall. It is assumed that the larger a facility is, the larger the outfall will be. Add the duration of the outfall and you get an order of magnitude of the amount of water that could potentially have overflowed from the facility.
Since these facilities of comparable size are found in all Quebec municipalities, it can be assumed that a medium-sized facility that overflows in Trois-Rivières will discharge the same amount of wastewater into the environment as a facility of the same size in La Tuque or Rimouski.
This index allows everyone, citizens and elected officials, to compare the probable impact of outfalls in their municipality with other municipalities in Quebec and to see where it is necessary to intervene as a priority to plug the gaps.
We know that this benchmark is effective, as we have validated it by applying it to 50 of the wastewater systems we have studied in recent years. It has substantiated all of the priority cases we identified in our analyses.
How is the intensity of outfalls calculated?
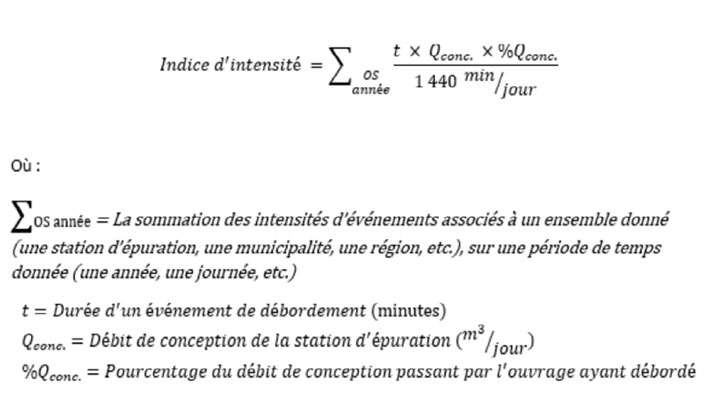
The index is reported over 1440 minutes (24 hours) because overflow events are measured in minutes and are considered daily (between 00:00:00 and 23:59:59) by the Ministry of the Environment (MELCCFP).
The intensity index is not a measure of the volumes of wastewater released to the environment from a facility when it overflows. Rather, it is the volume of wastewater that can theoretically pass through an overflow structure for the duration of an event without causing an overflow. This index still makes it possible to bring the capacities of overflow structures onto a common scale for comparison purposes.
The concept behind this index is that the higher the capacity of a structure, the larger its catchment area will be and therefore, the more likely it is to receive a significant water surcharge during overflow events.
The calculation of outfall intensity meets the following limitations:
- Without a spill duration, the calculation of the intensity of an event is based on a duration of 24 hours, which could lead to an overestimation of the duration of the event. This adjustment to our methodology is intended to avoid wrongly favoring certain municipalities with non-compliant practices, which would otherwise have experienced spill intensities equal to zero. This adjustment applies from the 2022 rankings and has led to a revision of the history of the rankings.
- It happens that the actual flow rates arriving at a treatment plant are different from its design flow rate. If the actual flow is much lower than the design flow, the index could be overestimated. On the contrary, if the actual flow is much higher than the design flow, the index could be underestimated.
- It happens that the percentage of flow passing through a structure is not entered correctly in its monitoring form.
How do we associate an outfall with one municipality rather than another?
Using data provided by the Ministry of the Environment (MELCCFP), we can associate each spill event with a specific overflow structure which is itself associated with a single wastewater treatment plant. Each treatment plant is ultimately associated with the municipalities connected to its sewer network.
The vast majority of municipalities operate their own wastewater treatment plants and therefore the method is not biased. This is not the case when a treatment plant serves more than one municipality, as the available data does not always allow us to distinguish which facilities belong to Municipality A and which belong to Municipality B. All results related to the treatment plant are associated equally with both municipalities, even though one of the two may be the primary source of the outfalls.
Why do this? Quite simply because almost half of the overflow structures in Quebec are not geolocated. If all the structures were geolocated, we would have been able to accurately associate the overflows with the municipalities. If you believe that your municipality is penalized by this method of calculation, insist that it transmit the geographical coordinates of its works to the MELCCFP. We can then eliminate this bias.
It is very easy to check if a given municipality is connected to a station outside its territory and if there may be such a bias, as shown in the following illustration:
Why divide the data by the number of residents?
A wastewater spill in Laval, for example, is always larger than a spill in La Pocatière, simply because it is a larger city. How can cities be compared to each other? By normalizing the data by the number of inhabitants of each municipality.
In doing so, municipalities can be accurately compared to each other and even a ranking of the best and worst performing cities in terms of municipal wastewater treatment can be established.
This is the default consultation mode that we offer:
- Per capita outfall intensity
- The number of spills
- Duration of spills
What is the order of magnitude of the size of municipalities?
It is preferable to compare municipalities with each other according to their size. We have defined 3 categories based on the population:
- Small: less than 10,000 citizens
- Average: between 10,000 and 100,000 citizens
- Large: over 100,000 citizens
How do we assess the quality of the measurement?
Measurement quality is an indicator we developed to assess a municipality's ability to accurately measure its overflow events.
Les enregistreurs électroniques de débordements (EED) sont une composante essentielle du bon suivi des performances des ouvrages de surverses, puisqu’ils permettent de mesurer précisément le nombre et la durée des débordements d’eaux usées. Cette méthode de mesure est beaucoup plus précise que celle dite du repère visuel, où une personne va constater qu’un flotteur dans l’ouvrage a été déplacé et qu’il y a eu un débordement dans les journées précédentes.
L’indicateur de qualité de la mesure rend compte de la proportion des ouvrages d’une municipalité qui sont dotés d’un EED fonctionnel et qui mesurent donc adéquatement la fréquence et la durée des débordements. Nous attribuons une valeur de 24h à tous les débordements qui n’ont pas une durée rapportée par des EED.
Les pourcentages sont traduits en note alphabétique selon les barèmes suivants:
A+: [100%]
A : [90% to 100%[
B : [75% to 90%[
C : [60% to 75%[
D : [45% to 60%[
E : [25% to 45%[
F : [0% to 25%[
What values does the map color scale correspond to?
To measure the performance of municipalities, they are ranked in ascending order of the number, duration or intensity of their outfalls. Each of these lists is then broken down into five 20% bands to produce what statisticians call quintiles. These are five equal parts that include an equal number of municipalities. Values that are zero or equal to zero are isolated and classified as "Null or Inapplicable".
The "Very Low" category includes the 20% of municipalities that reported the smallest values greater than zero, and the "Very High" category includes the 20% of municipalities that reported the largest values for the given situation (the number of outfalls in 2019, for example). This method of categorization means that the thresholds between these categories (called quantiles) will change from year to year, as the categorized values also change from year to year.
As an example, here are the intensity and per capita thresholds for the years 2017 and 2019:
Why are the values lower before 2017?
Prior to 2017, the number and duration of outfalls were measured by the "visual benchmark" method: an employee would visit the plant and observe an outfall (or not) and note the estimated duration of the outfall. Thus, data from before 2017 are of poorer quality than those obtained from 2017 onward.
Today, all municipalities are held by thearticle 9 of Regulation respecting municipal wastewater treatment works (ROMAEU) to have an electronic overflow recorder (EED) which automatically measures the duration of each spill on structures that have experienced spills in the past. This regulation has been in force since January 2014.
In practice, 10 % of the works are still not equipped with EED. To find out what we are doing so as not to disadvantage municipalities that comply with the regulation, refer to the question How is the intensity of outfalls calculated?
Questions and answers for municipal managers and associations
The ranking should take into account the characteristics of sewer systems in its analysis.
The network characteristics (its type, meaning combined, pseudo-separative or separative) cannot be taken into account at the moment. The ranking is based on public information and this data is not offered by the Ministry of the Environment (MELCCFP). Furthermore, if this information were available, it would be complex to interpret in a matrix format (a table) at the scale of individual works, both for the MELCCFP and for the Fondation Rivières. It would also be difficult for municipalities with limited resources to produce and maintain such information.
The ranking should take into account the capacity of receiving environments in its analysis.
Even before the release of our first ranking in 2020, we wanted to be able to develop such an indicator. Instead, we chose to rank based on the intensity index after assessing that we were not able, with the resources at our disposal, to consider impacts on receiving environments in our analysis.
Including the capacity of receiving environments would require modeling the flows of all streams receiving overflows or discharges of treated wastewater, while considering the seasonal variability of the flows of said streams to have a representative indicator. This would be a major development project that would require many more resources than are currently available.
Municipalities that correctly report the duration of overflows are penalized in their ranking.
We had until now chosen to carry out our calculations from raw data provided by the Ministry of the Environment (MELCCFP), with the durations as reported in Monitoring of municipal wastewater treatment works (SOMAEU) so as not to overestimate the durations of overflows. On the other hand, this had the effect of wrongly favoring certain municipalities with non-compliant practices.
To avoid penalizing those who comply with the Regulation respecting municipal wastewater treatment works (ROMAEU) en vigueur depuis 10 ans (janvier 2014), nous attribuons désormais des durées de débordement de 24 h à tous les déversements s’étant produits à partir d’ouvrages dépourvus d’enregistreurs électronique de débordement (EED) opérationnels, comme le fait le MELCCFP pour les débordements rapportés sur les ouvrages utilisant la méthode du repère visuel. Ce changement se reflète dans notre palmarès 2022. Nous espérons que cela aura pour effet d’inciter l’installation d’EED sur les ouvrages de surverses qui en nécessitent.
The figures reported by the Fondation Rivières on the number of overflows, diversions or structures are higher than those communicated in the reports produced by the Ministry of the Environment (MELCCFP).
Les données du palmarès et de la carte que nous publions sont basées sur les données brutes de l’ensemble des événements rapportés dans le Suivi des ouvrages municipaux d’assainissement des eaux usées (SOMAEU) pour l’année complète. Ces données diffèrent de celles communiquées par le MELCCFP dans les rapports annuels du SOMAEU qui sont consultés par la majorité des gestionnaires municipaux. Les rapports annuels ne rapportent que les déversements qui se produisent durant les périodes normées, entre mai et fin septembre pour la plupart des régions.
Les débordements en période printanière (de mars à mai), qui représentent en moyenne près de 60% de l’intensité annuelle des débordements rapportés, sont donc généralement ignorés dans ces rapports.
Toutefois, nous présentons désormais les données sur le respect des normes de débordement dans un second tableau intitulé Respect des normes. Vous pouvez donc consulter ces chiffres en parallèle des tableaux et cartes habituels du Palmarès.
My municipality is not responsible for overflow from the neighbouring municipality. Why are our tracking data combined?
Au Québec, les stations d’épuration, ouvrages de surverses et tronçons d’égout sont désignés comme étant des ouvrages municipaux d’assainissement des eaux usées (OMAEU). Chaque ouvrage est associé à une municipalité qui en assume la responsabilité et cette association est définie par les exploitants municipaux.
Les débordements d’eaux usées sont donc attribués aux municipalités qui assument la responsabilité des ouvrages en cause.
Notre portrait est représentatif dans la majorité des cas, mais il l’est moins dans le cas des municipalités qui se sont regroupées pour confier la gestion de leurs eaux usées à des régies intermunicipales.
Lorsqu’une régie est responsable d’ouvrages partagés entre plusieurs municipalités, nous n’avons pas les informations nous permettant de déterminer si les débordements des ouvrages sont attribuables à une municipalité plutôt qu’à une autre. Nous n’avons d’autre choix que de les répartir entre les municipalités.
Si vous êtes gestionnaire d’une municipalité et que les données ne vous paraissent pas exactes, communiquez avec nous. Nous faisons les ajustements lorsque nécessaire.
Why is my municipality not represented in your ranking?
Le palmarès ne présente que les moyennes et grandes municipalités, soit celles de plus de 2 000 habitants. Dans le cas des petites municipalités, les chiffres fournis par le ministère mènent à des intensités de déversement qui sont surévaluées et qui ne représentent pas bien leur réalité. Leurs performances sont toutefois consultables sur la carte des déversements.
Toutes les municipalités avec des ouvrages d’assainissement sont représentées dans le tableau sur le respect des normes.
Help us preserve the quality of water in Quebec's rivers
The ranking encourages elected officials to correct sanitation problems. Help us increase the impact of the rankings!
Donate


